6-4 Tutorial
By using an actual sample this section describes the program compilation/link, creation of the ROM image file, and the debugging method. Before you use the sample, we will describe the procedure for creating the ROM image file. Proceed to the next step after you have an understanding of this.
6-4-1 Procedure for creating the ROM Image File
The ROM image file is created by specifying the object file and the picture/sound data to the ROM image creation tool after you have created the Relocationable object file one time using the compiler/linker. (Relocationable object file: Object files where the function and argument
addresses have not been determined)
The ROM image creation tool outputs the ROM image file and the debugger symbol file. If no file name has been specified, use the following for output:
The ROM image file : rom.n64
The symbol file : rom.out
If you specify the file name, do not change the extensions: specify each of them to make a pair.
[Example]
The ROM image file : sample.n64
The symbol file : sample.out
6-4-2 The compilation/link/creation of the ROM image, using an actual sample.
Now let us do the compilation/link/creation of the ROM image, using an actual sample. Here, we will use the sample called, "simple." In this manual, it has been set up in the directory, "c:\ultra\src\PR\simple". Activate "MS-DOS prompt" from "Windows 95", and go to the directory, "simple"
1. Makefile
The compilation/link/ROM image creation in "simple" are done using the program, "make." "make" provides the process based on the contents defined in the text file, "Makefile" (See "The exeGCC (N64) handling manual" for details).
Now we will describe the contents defined in "makefile." Open the text file, "Makefile", in the directory of "simple" with your editor. (The actual "Makefile" does not describe the following #comments.)
[Makefile]
LIB = $(ROOT)/usr/lib #
Specify the pass of the N64 OS library
LPR = $(LIB)/PR # Unused in "simple".
INC = $(ROOT)/usr/include # Specify the pass pf the N64 OS header file.
CC = gcc #
Specify the compiler
LD = ld #
Specify the linker
MAKEROM = mild # Specify the ROM image creation tool.
.c.o: # Specify the dependent relation between the .c and .o file.
# Provide the following process if .c is updated.
$(CC) -g -G 0 -c -I. -I$(INC)/PR -I$(INC)-D_LANGUAGE_C
-D_MIPS_SZLONG=32 -D_MIPS_SZINT=32 -D_DEBUG $<
#
Specify the creation of the object file by using the compiler.
# Output the object file having the debugger source code information
# by combining "-g" and "-c".
# -G 0 -I$(INC)/PR -I$(INC) -D_LANGUAGE_C
-D_MIPS_SZLONG=32 -
# D_MIPS_SZINT=32 is the required option when you use the N64 OS.
# -I.-D_DEBUG is the option for simple.
APP = simple.out #
Specifies the symbol file name for debugger
TARGETS = simple.n64 # Specifies the ROM image file name
HFILES = \ # Specifies the header file name for "simple"
:
CODEFILES = \ # Specifies the .c (the program code) file name
:
CODEOBJECTS = $(CODEFILES:.c=.o)
# Specifies the .o (the program code) file name
#
(The name is replaced from .c to .o, which is
#
the file name specified in CODEFILES)
# Example) test.c->test.o
CODESEGMENT = codesegment.o
#
Specifies the relocationable object file name created
#
as a result of linking the program code
DATAFILES = \ # Specifies the .c (data) file name
:
DATAOBJECTS = $(DATAFILES:.c=.o)
# Specifies the .o (data code) file name
# (Same as CODEOBJECTS above)
OBJECTS =$(CODESEGMENT) $(DATAOBJECTS)
# Specifies all relocationable object file names
#
Specifies to the ROM image creation tool
LDFLAGS = $(MKDEPOPT) -L$(LIB)
-lgultra_d-L$(GCCDIR)/mipse/
-liblkmc
#
Specifies the option to specify to the linker
# "MKDEPORT" is a reserved name and required option when you create
#
the relocationable object file by using the linker.
# "-L$(LIB)-lgultra_d" is the option to link the N64 OS library.
# "-L$(GCCDIR)/mipse/lib-lkmc" is the required option when you link
#
the object file created by the compiler
default: $(TARGETS) #
This "make" is the specification of creating
#
the ROM image file by default
$(CODESEGMENT): $(CODEOBJECTS)makefile
# Specify the dependent relation among "codesegment.o", the .o file and "Makefile"
# Provide the following process when ".o" and "Makefile' are updated:
$(LD) -o $(CODESEGMENT) -r $(CODEOBJECTS)$(LDFLAGS)
#
Specify the creation of the relocationable object file by using the linker.
# "-o $(CODESEGMENT)" is the option to specify the output
# file name.
# "-r" is the option to create the relocationable object file.
# $(CODEOBJECTS) Specifies the linking object file name
# $(LDFLAGS) is the specification of passing other options to the linker
$(TARGETS): $(OBJECTS)
# Specify the dependent relation between the ROM image file and all ".o" files.
# Provide the following process if ".o" is updated:
$(MAKEROM) spec -r $(TARGETS) -e $(APP)
# Specify the creation of the ROM image file by using
# the ROM image creation tool.
# "spec" is the text file to specify the ROM image to the ROM
#
image creation tool. This will be mentioned later.
# "-r $(TARGETS)" is the option to specify the ROM image
# file name.
# "-e $(APP)" is the option to specify the symbol file name.
|
The contents described here are just one example. The compiler/linker/ROM image creation tool has many other convenient functions. Utilize them based on what the program can be used for.
2. Specifying the ROM Image
Next, we will cover the contents defined within the script file to specify the ROM image. Open the text file, "spec", in the directory, "simple", with your editor (In the actual spec, the following /*comments*/ are not described.)
Read "The ROM Packer-specfile format" from "The exeGCC (N64) handling manual" along with this description.
[spec]
/* The ROM image manages in units of segments.*/
/*
Define the segments having the program code attributes.*/
beginseg /*
Initiate to define the segments */
name "code" /*
Specify the segment names */
flags BOOT OBJECT /* Designate the boot attribute and the object attribute
*/
entry boot /*
Specify the boot function */
stack bootStack + STACKSIZEBYTES
/*
Specify the stack used by the boot function*/
include "codesegment.o"
/*
Specify the object file mapping within the segment
*/
include "$(ROOT)/usr/lib/PR/rspboot.o"
/* Specify the boot microcode.
*/
include "$(ROOT)/usr/lib/PR/gspFast3D.o"
/*
Specify the graphics microcode */
include "$(ROOT)/usr/lib/PR/gspFast3D.dram.o"
/*
Specify the graphics microcode */
include "$(ROOT)/usr/lib/PR/aspMain.o"
/*
Specify the sound microcode */
endseg /* End defining the segment */
/* The following is the description only about the parts which don't overlap with the "code" segments
*/
beginseg
name "gfxdlists"
flags OBJECT /*
Designate the object attribute */
after code /* Specify mapping right after the "code" segment.
*/
include "gfxdlists.o"
endseg
beginseg
name "zbuffer"
flags OBJECT /*
Designate the object attribute */
address 0x801da800
/*
Specify mapping on the 0x801da800 address
*/
include "gfxzbuffer.o"
endseg
beginseg
name "cfb"
flags OBJECT /*
Designate the object attribute */
address 0x80200000
/* Specify mapping on the 0x80200000 address
*/
include "gfxcfb.o"
endseg
beginseg
name "static"
flags OBJECT /*
Designate the object attribute */
number STATIC_SEGMENT /* Specify the static segment number
*/
include "gfxinit.o"
include "gfxstatic.o"
endseg
beginseg
name "dynamic"
flags OBJECT /*
Designate the data attribute */
number DYNAMIC_SEGMENT /* Specify the dynamic segment number
*/
include "gfxdynamic.o"
endseg
beginseg
name "bank"
flags RAW /*
Designate the data attribute */
include "$(ROOT)/usr/lib/PR/soundbanks/GenMidiBank.ctl"
/*
Specify the sound bank data
*/
endseg
beginseg
name "table"
flags RAW /*
Designate the data attribute */
include "$(ROOT)/usr/lib/PR/soundbanks/GenMidiBank.tbl"
/*
Specify the sound table data. */
endseg
beginseg
name "seq"
flags RAW /*
Designate the data attribute */
include "$(ROOT)/usr/lib/PR/sequences/BassDrive.seq"
/*
Specify the sound sequence data */
endseg
beginwave /*
Initiate to define waves
*/
name "simple" /*
Specify the symbol file name (Ignore ".out")
*/
include "code" /*
The following are the specification of mapping segments. */
include "gfxdlists"
include "static"
include "dynamic"
include "cfb"
include "zbuffer"
include "table"
include "bank"
include "seq"
endwave /*
End the wave definition */
|
The above is the required procedure to provide the compilation/link/ROM image creation to the sample with "make".
3. Executing "make"
Now, let us actually execute "make". Execute "make" from the directory, "simple".
C:\ULTRA\USR\SRC\PR\SIMPLE>make
After the end of "make", the ROM image file, "simple.n64", and the symbol file, "simple.out" will have been created. Verify it with the DIR command, etc.
6-4-3 Executing the sample
Try to execute the sample by using the ROM image file and the symbol file which were created in "6-4-2: The compilation/link/creation image creation of the sample" (we use "simple" here again). Carry out the execution of the sample by using the debugger (See "PARTNER" below). Proceed using the following procedure.
1. Activating "PARTNER"
Click the icon, "N64 WRT64", from "Windows 95" - "Start" - "Program(P)" - "PARTNER-N64", with the left mouse button.

2. Load the file
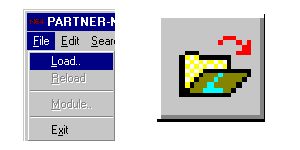
Click "File(E)" - "Load(L)" of the PARTNER main menu or the load icon on the tool bar with the left mouse button.

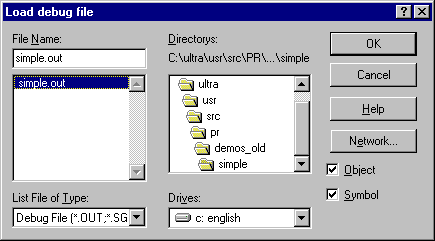
The dialog box for the file load is displayed. After going to the directory which contains, "simple", select the file, "simple.out", with the left mouse button and click the "OK" button with the left mouse button.

3. The execution
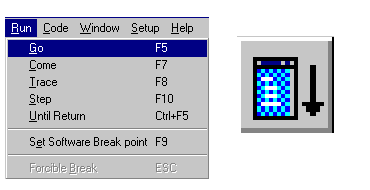
Click "Run(R)" - "Program run(G) F5" from the PARTNER main menu, or the execute icon on the tool bar with the left mouse button.

4. Ending the program
Press the "ESC" key, or click the stop icon on the tool bar with the left mouse button.

6-4-4 Debugging the sample
This section describes some debug examples by using the sample (the operating method of PARTNER). We use, "simple", here again.
1. Setting/freeing the breakpoint
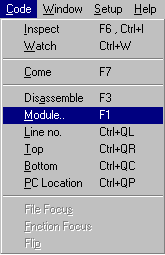
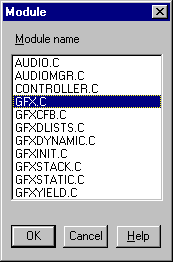
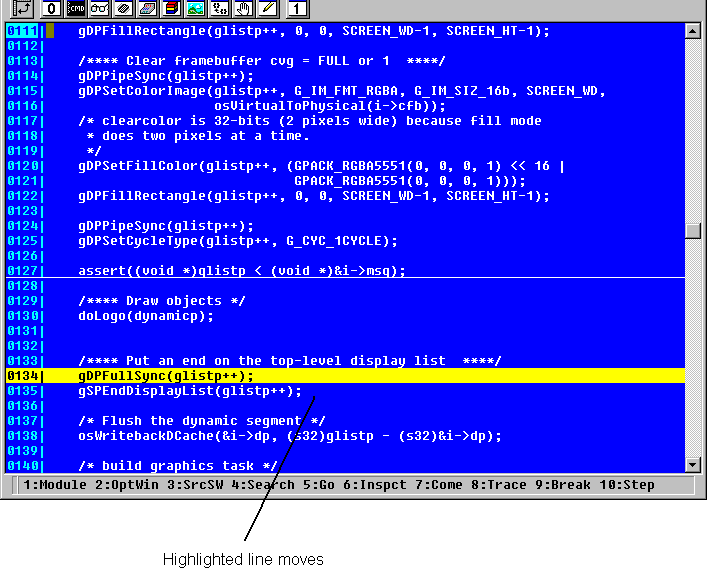
First, we will describe the setting method of the breakpoint. Set the breakpoint within "simple" - "gfx.c" - "createGfxTasc()". After loading the sample, click on, "Code(C)" - "Module(M) F1", in the PARTNER main menu with the left mouse button.

After clicking, the modules list box is displayed. Select "GFX.C" with the left mouse button, and click the "OK" icon with the left mouse button.

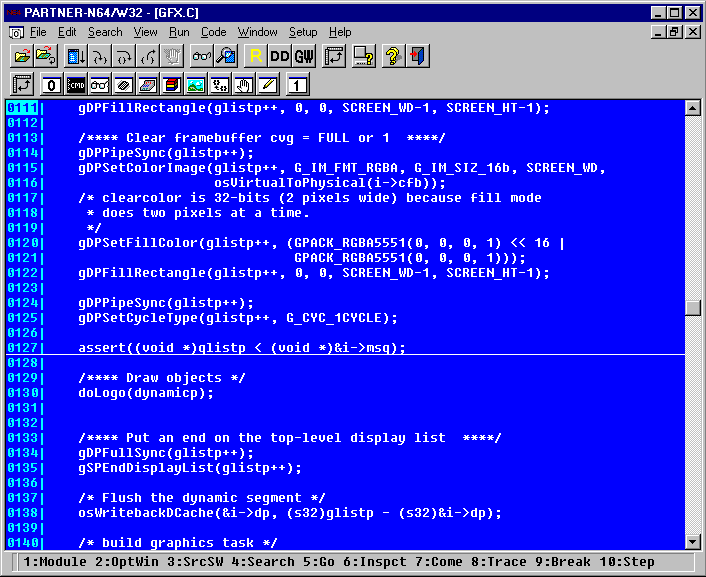
After selecting the module, the contents of "GFX.C" are displayed in the PARTNER command window. Use the scroll bar and scroll down in sources until "createGfxTasd()" (The line numbers are displayed on the left side of the code window, so scroll to between the 110th and 130th line). The 127th line of "GFX.C" contains a portion for bringing up the assert() function. Bring the mouse cursor to this line number and click on it with the left mouse button. A line is displayed under the line which is bringing up the assert() function of the code window.
Now we have set the breakpoint.

Next, run the program.

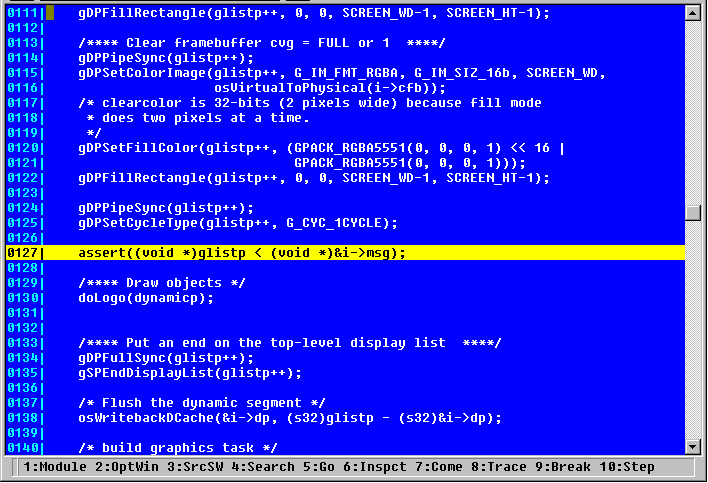
After running, the color of the line which set the breakpoint is highlighted and the program breaks. When you free the breakpoint, click the line number with the left mouse button in the same way as with the setting. After clicking, the underline of the line set to the breakpoint disappears. Now we have removed the breakpoint.
2. The step execution/ the trace execution/ the trace execution of the program.
First, execute the contents explained in "1. Setting/freeing the breakpoint." After the break, do the step execution.
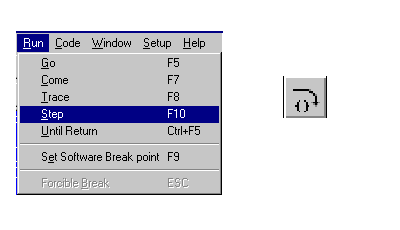
For the step execution click "Run(R)" - "Step(S) F/O" in the PARTNER main menu, or the step icon on the tool bar with the left mouse button.

After clicking, the line that was highlighted in the code window proceeds in the program process. This shows that the STEP 2 execution is being done.
 |
The trace execution is also done in the same way as the STEP 2 execution. The difference between this and the STEP 2 execution is that if the function call is provided, the trace execution goes into the function. However, the STEP 2 execution carries out the function call and does not enter the function.
3. The dump/editing
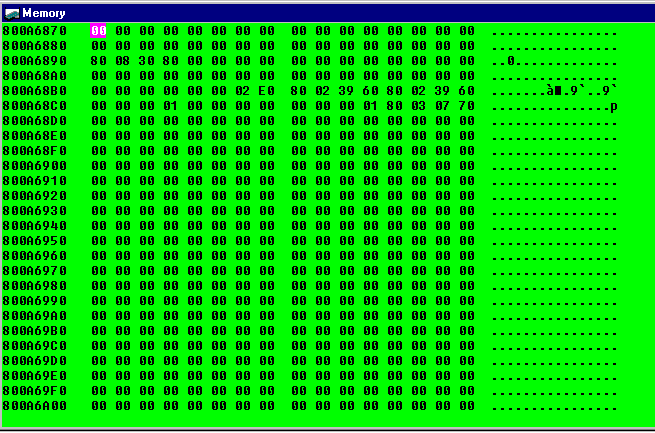
This section describes the dump/editing functions. First, execute the contents explained in "1. Setting/freeing the breakpoint". After the break, do the dump. The dump has two kinds of methods, using "d command" from the command window and using the memory window.
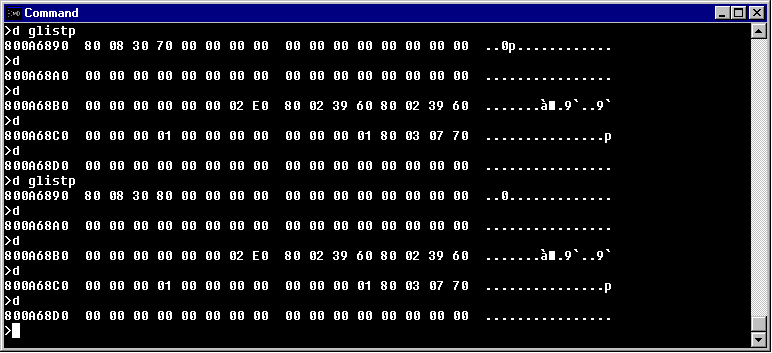
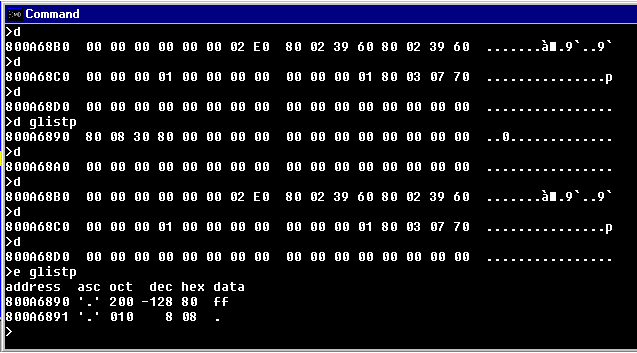
Next, try to dump from the command window. In "createGfxTask()", the data is set up in the argument, "glistp". Proceed with dumping this content. Input the following in the command window.
>d glistp
After inputting, the 16-byte dump data is displayed in the command window. If you do a dump follow this by simply entering the "d command". The dump data is displayed in units of 16-bytes.

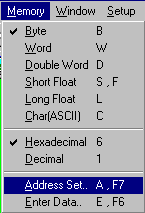
Though we described here only the dump in units of bytes, you can dump with various sizes using "d command". Try out some of these. Next, we will do a dump from the memory window. Open the memory window. Bring the mouse cursor into the memory window and right click. A pull-down menu is displayed. Select "Setting address(A)A, F7" and click it. (Either the right or left button is OK.)
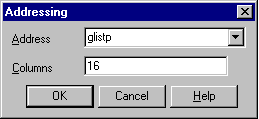
After clicking, the address-specify window is displayed. Input "glistp" in "Address (A)" and click the "OK" icon with the left mouse button.


After clicking, the dump data is displayed in the memory window.

Next, do editing. Editing, similar to the dump, also has two kinds of methods, using "e command" from the command window and using the memory window. First, edit from the command window. With the editing, we will use the argument "glistp" as well. Input the following in the command window.
>e glistp
After inputting, the input status changes to wait. Input "ff", and input "." next ("." specifies the completion of editing)

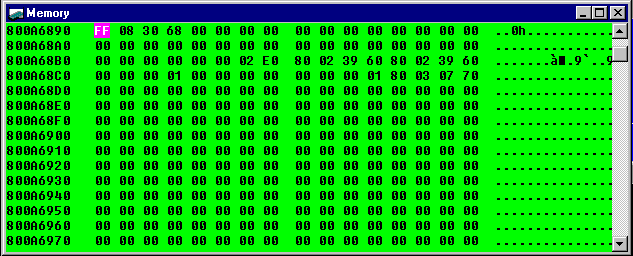
Though we have only described the editing in units of bytes here, you can edit with various sizes using "e command". Try out some of these. Next, we will do editing from the memory window. Open the memory window in the same way as with the dump. Here, make sure the first byte of "glistp" is "FF". The reason for this is that the contents of "glistp" were changed by using "e command" in the command window before opening the memory window.

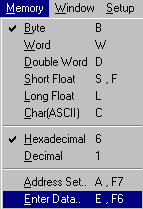
Here, to return "glistp" to its original content, we will edit in the memory window. Bring the mouse cursor to the first byte in the memory window and click the right button of the mouse. A pull-down menu is displayed. Select "Data change(E) E, F6" and click. (Either the right or left button is OK)

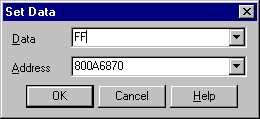
After clicking, the data set window is displayed and the value "FF" is entered in "Data (D)."

Input "80" in "Data (D)" and click the "OK" icon with the left mouse button. After clicking, try to dump "glistp" again. You will find that the first byte is "80".
4. Refer to the Argument of C
This section describes about the source code debug function to reference the arguments of C. First, execute the contents described in "1. Setting/freeing the breakpoint."
After the break, we will reference the argument.
First of all, let's try to provide the reference using the inspect window.
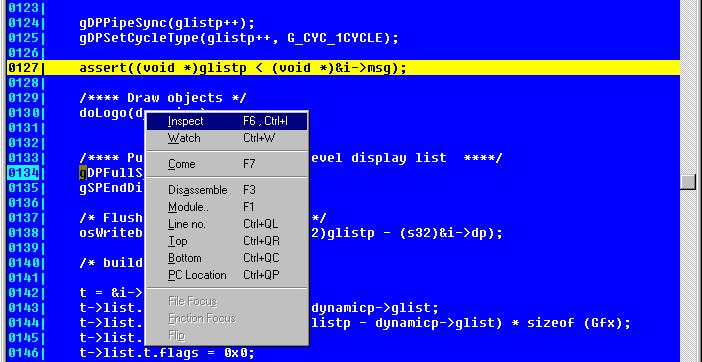
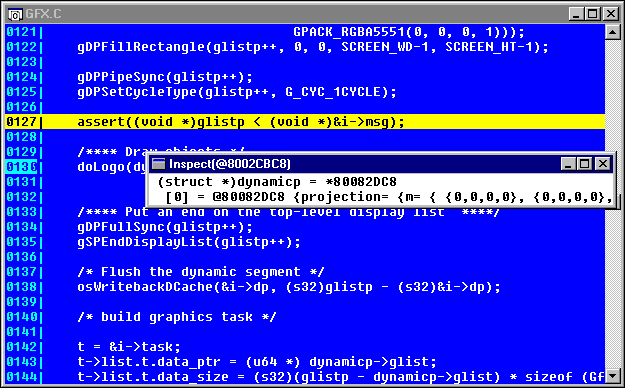
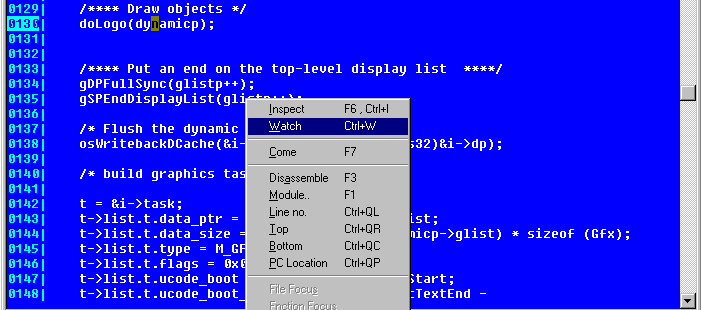
In "createGfxTask()", the local argument "dynamicp" is passed to the function "doLogo()". Set the mouse cursor on "dynamicp" in the code window, and click the right button of the mouse. A pull-down menu is displayed. Select "Inspect(I) F6, Ctrl+I" and click. (Either the right or left button is OK.)


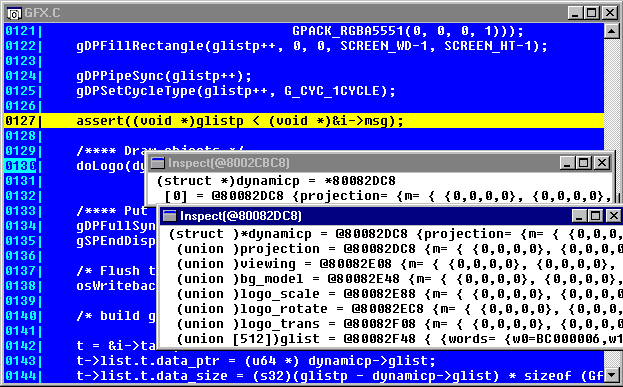
After clicking, the inspect window is displayed and you can look up the contents of "dynamicp". The inspect window is displayed in horizontal lines. If it's hard to see, double-click the @ address in the inspect window with the left mouse button. You can display them vertically.

Next, we will provide the reference using the watch window. The operation of the watch window is basically the same as the inspect window. Set the cursor on "glistp" in the code window and click the right button of the mouse. A pull-down menu is displayed. Select "Watch (W) Ctrl+W", and click. (Either the right or left button is OK.)

After clicking, the watch window is displayed, and you can look up the contents of "glistp"

The watch window can also be displayed vertically, in the same way as the inspect window, by double-clicking the @ address or * address in the window with the left mouse button.
Finally, if you want to look up the local argument, you can do so by opening the local window. It is not necessary to do the inspect and watch.

The local window can also be displayed vertically, in the same way as the inspect window, by double-clicking the @ address or * address in the window with the left mouse button.
5. The Debug Print
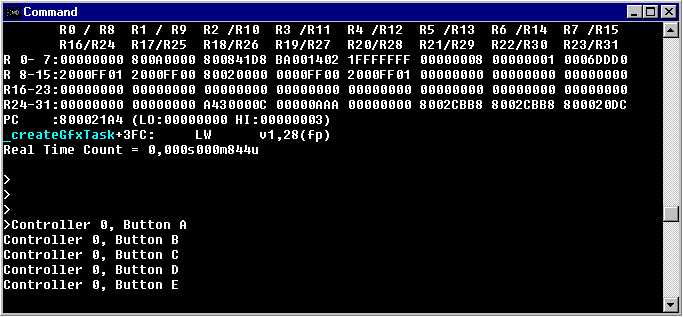
In PARTNER, you can look up the debug print during programming. To display the debug print, "osSyncPrintf( )", set up in the N64 OS functions, is used. The output result of "osSyncPrintf( )" is displayed in the command window. "simple" is the program which displays the debug print when the A, B and C buttons of the controller are entered. After loading "simple", execute it without setting the breakpoint. When you enter the controller button during the execution of the program, the debug print is displayed in the command window.

All of the above are examples of simple debugs. PARTNER has other various functions, so you will be able to find the most suitable debugging method from among them.

